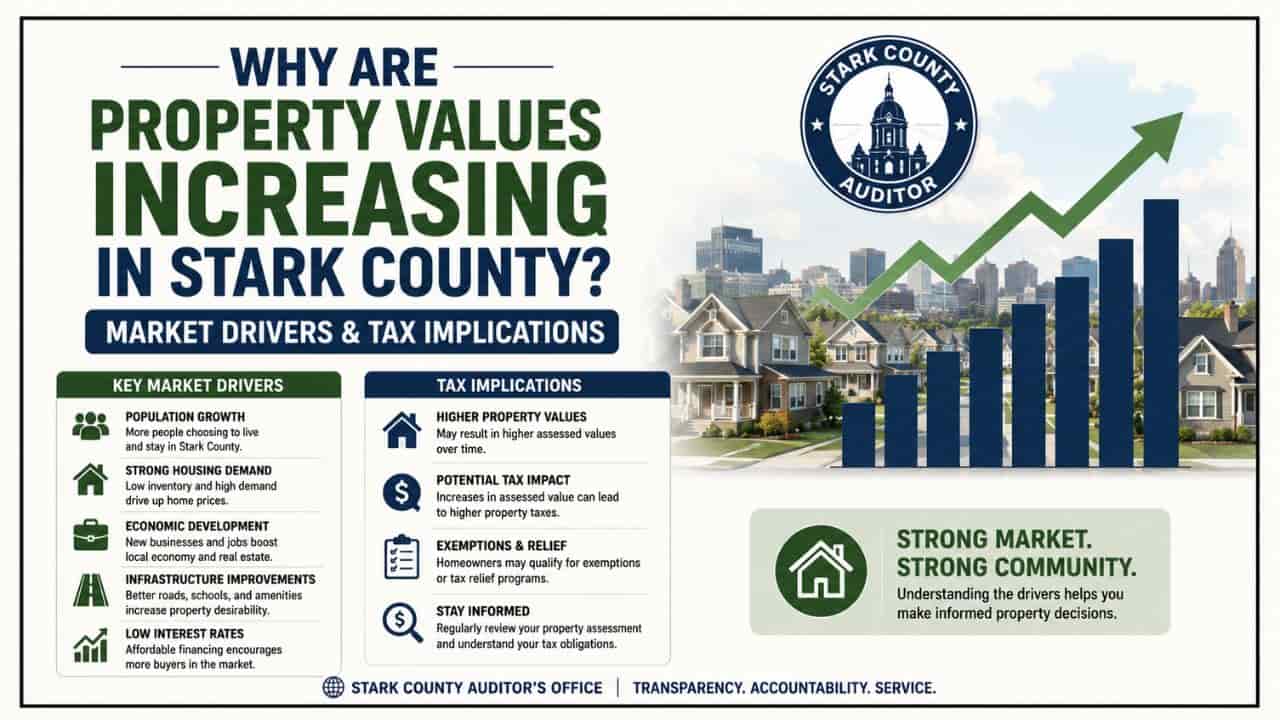
Understanding regional property trends requires a methodical approach backed by verified public registry metrics. In 2026, the Stark County, Ohio real estate ecosystem, encompassing the economic hubs of Canton, Massillon, and Alliance presents a highly resilient operational landscape. Driven by low foreclosure volumes and steady inventory turnover, the local market balances equity growth with long-term stability. This institutional-grade analysis breaks down official transactions across the Stark County property search portal, analyzing regional localized values and mortgage financing trends to deliver complete macroeconomic market clarity for investors.

Macro Market Data Overview: The Baseline Indicators
A technical audit of Stark County’s total housing and commercial inventory demonstrates robust baseline health. The structural data segment below outlines the core real estate metrics established through recent fiscal tracking.
| Property Market Metric | Current Certified Data Value | Strategic Analytical Utility |
| Total Residential Inventory | 143,378 Properties | Defines the absolute scale of the regional housing sector for supply-side modeling. |
| Total Commercial Inventory | 10,720 Properties | Identifies the physical depth of local industrial, retail, and mixed-use business infrastructure. |
| Median Residential Valuation | $230,000 | Establishes the centralized pricing baseline for comparative market evaluations. |
| Equity-Rich Asset Ratio | 36.5% of Core Inventory | Indicates strong homeowner wealth retention, directly minimizing systemic foreclosure risks. |
The typical single-family home footprint across the county averages 1,611 square feet, with a mature structural age profile averaging 65 years. This creates a prime ecosystem for equity-add renovations and modern retrofitting projects, particularly within older residential neighborhoods. Furthermore, homes considered seriously underwater sit at a nominal 1.45%, validating the overall financial security of the local community.
Historical Price Trajectory & Transaction Liquidity
Residential valuations across the Stark County database have experienced an upward shift, with the median sales price consolidating at $230,000. This reflects a strict 11.7% year-over-year growth rate driven by sustained buyer demand.
Chronological Media Pricing Index
To trace transaction stability, investors must evaluate historical sales data points over consecutive cycles:
- November 2025 Closing Window: $230,000 (Reflecting an 11.7% Year-over-Year upward adjustment).
- Late Summer 2025 Compression (August): $213,000.
- Spring 2025 Opening Baseline (May): $200,000.
Market liquidity remains fluid, supported by 7,711 residential properties successfully transferring title over a trailing 12-month sequence. Monthly home sales consistently hover between 570 and 700 units, ensuring that multi-list assets retain reliable exit options for developers and sellers looking to liquidate positions.
Hyper Local Property Values Indexed by Municipal Tax District
Real estate valuations across the county vary significantly by township lines and school boundaries. The comprehensive index below breaks down median estimated values and average price per square-foot metrics across individual Stark County municipalities.
| Designated Municipal Locality | Median Estimated Value | Average Price Per Square Foot |
| Hartville | $302,051 | $163.38 |
| North Lawrence | $300,951 | $168.07 |
| North Canton | $290,040 | $153.76 |
| Paris | $286,884 | $163.03 |
| Canal Fulton | $270,500 | $167.41 |
| Beach City | $263,219 | $163.04 |
| Louisville | $246,596 | $150.42 |
| Navarre | $240,971 | $150.06 |
| Middlebranch | $239,000 | $157.06 |
| Alliance | $225,585 | $140.00 |
| Massillon | $222,750 | $140.38 |
| East Canton | $203,491 | $134.27 |
| East Sparta | $197,372 | $131.37 |
| Minerva | $182,838 | $115.47 |
| Canton (Urban Core) | $181,542 | $116.96 |
| Waynesburg | $176,086 | $114.90 |
| Brewster | $163,159 | $124.19 |
| Limaville | $130,255 | $92.41 |
| Robertsville | $113,118 | $86.36 |
Mitigating Distressed Inventory: 2025 vs 2026 Foreclosure Realities
A major driver behind Stark County’s stable pricing trends is the remarkably low volume of distressed inventory entering the open market. Traditional retail inventory values avoid sudden downward price spikes because lender owned liquidation properties are historically tightly controlled.
However, looking at the transition from 2025 into 2026, we see a gradual normalization of the foreclosure pipeline as judicial backlogs clear up.
| Real Estate Metric | 2025 Historical Baseline | 2026 Current Market Status | Strategic Local Impact |
| Total Foreclosure Filings | 56 Filings (Nov 2025) | Gradual upward normalization following national stabilization trends | Maintains a steady procedural volume in the local judicial auction pipeline. |
| Completed Foreclosures (REOs) | 1 Property | Marginal year-over-year adjustments in bank repossessions | Provides seasoned wholesale investors with minor upticks in bank-owned property inventory. |
| Average Processing Timeline | 600+ Days | 577 Days on average across Ohio jurisdictions | Faster legal case resolutions speed up the turnaround time for distressed assets. |
2026 Structural Rules for Court Auctions
If you are tracking distressed or tax-delinquent properties through public records in 2026, you must adapt to recent structural shifts in Ohio’s legal processing:
- Transition to Online Sheriffs Sales: In compliance with updated state mandates, Stark County has transitioned its official property auctions from physical courthouse bidding to secure online public portals.
- Weekly Transaction Schedules: Official foreclosure auctions are executed digitally every Monday at exactly 10:00 AM Eastern Time.
- Strict Deposit Constants: Successful bidders are legally required to submit a minimum 10% certified deposit by 4:30 PM on the day of the sale, with the remaining balance due within 30 days.
Mortgage Underwriting & Financing Trends
Local financing activities highlight a financially secure and proactive base of property owners. Underwriting metrics reveal two clear shifts in consumer behavior:
The Rise of Equity Position Capitalization
New purchase loan originations grew at a steady 5% clip, matching the overall transaction flow of the market. Concurrently, refinancing agreements (REFI) rose by 9.9%, indicating that local homeowners are actively adjusting their loan structures to capitalize on accrued property values.
Strengthening Down Payment Foundations
The median down payment size in Stark County climbed to $20,500, marking a 6.4% year-over-year expansion. This upward trend proves that incoming buyers are bringing substantial cash reserves to the closing table. Increasing upfront equity reduces default risks and reinforces the long-term price floors of local neighborhoods.
Buyer Equity Position = up-arrow / Median Down Payment ($20,500)} + down arrow / Underwater Ratio (1.45%)
Conclusion
The 2026 Stark County real estate profile is characterized by steady equity accumulation, exceptional market liquidity, and minimal distressed inventory pressures. From the premium luxury corridors of Hartville and North Canton to affordable residential opportunities in Alliance and Canton’s urban core, the county offers a diverse mix of investment pathways. By aligning acquisition strategies with certified public record trends, smart buyers can confidently build long-term real estate equity.
FAQs
What is the current median home price in Stark County, OH?
The certified median home price sits at $230,000, following a clear 11.7% annualized growth trend.
How many properties are actively traded across Stark County annually?
Local market tracking reveals that 7,711 residential properties transferred ownership over the past 12 months.
Which Stark County municipalities hold the highest property valuations?
Hartville, North Lawrence, and North Canton lead the regional market with baseline valuations exceeding $290,000.
Is the local real estate market vulnerable to a surge in foreclosures?
No. Completed bank foreclosures (REOs) remain near zero, keeping distressed inventory from disrupting local price stability.
What percentage of Stark County homeowners hold an equity-rich status?
Currently, 36.5% of localized residential properties are classified as equity-rich, reflecting excellent long-term financial health.